Hello and welcome to my first blog post for the Deluge! This the fifth collection I have had the pleasure to work on as a library assistant.
Due to the COVID-19 crisis, I am writing this blog from my makeshift home office/dining room here in Riverside, California, and the transition to online work has sure been an interesting challenge. I am extremely grateful to have the opportunity to work on the California Water Documents collection from home by checking the types of datasets provided by objects within the digital repository. I observe whether the data is presented in a map, chart, or table and I also note the number and size of the data. What I have gleaned the most from this collection is there are often yearly reports with the same kind of data provided, but one notices the changing numbers on reservoir elevations, expenditure budgets, and agricultural statistics.
I selected two data materials that share information on irrigation throughout California in the 1920s, and they can be found in the bulletin, Irrigation requirements of California lands 1923; being appendix ‘B’ to Report to the Legislature of 1923 on the Water Resources of California. The first item is from Chapter V, Sections 1-9, which includes Table 1. Agricultural Areas and Net Duty of Water The second object comes from Chapter VII of the same bulletin.
Chapter V covers the irrigation requirements of agricultural lands spanning 22,506,000 acres in California. That is well over the size of 11 Rhode Islands!
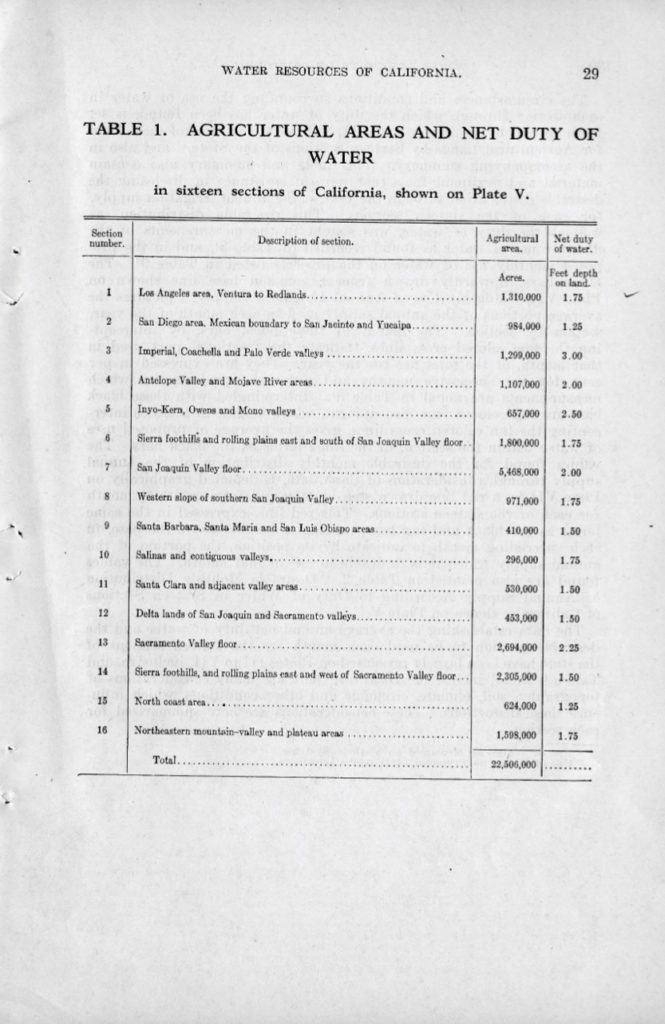
California is divided into 16 sections where Section 1 encapsulates the Los Angeles area from Ventura to Redlands and Section 2 names the area from the Mexican boundary to San Jacinto and Yucaipa as the San Diego area. The other important data provided by this table is the net duty of water in feet depth on land required for each of California’s 16 Sections. Net duty of water is defined by environmental engineers as the amount of water delivered to the land to produce a crop, measured at the point of delivery to the field. Interesting here is the largest feet depth to land net duty of water is required by the Imperial, Coachella, and Palo Verde valleys.
Table 2 shows the percentage of water supply required for each agricultural area throughout the year. There is no surprise that the largest consumption of agricultural water happens between June and August.
The following text within the object is written descriptions of the agricultural area and usage of water within the 16 Sections of California. There is some minimal data here, but one only needs to reference the first two tables in this document to garner data regarding agricultural water in California during 1920-1923.
Chapter VII covers deficiencies in water usage by the 16 Sections of California and features helpful precipitation collection data. An interesting chart, Plate II between pages 74 and 75, shows a bar graph of three sections in CA and their average monthly supply used in black versus the desirable monthly supply in red.
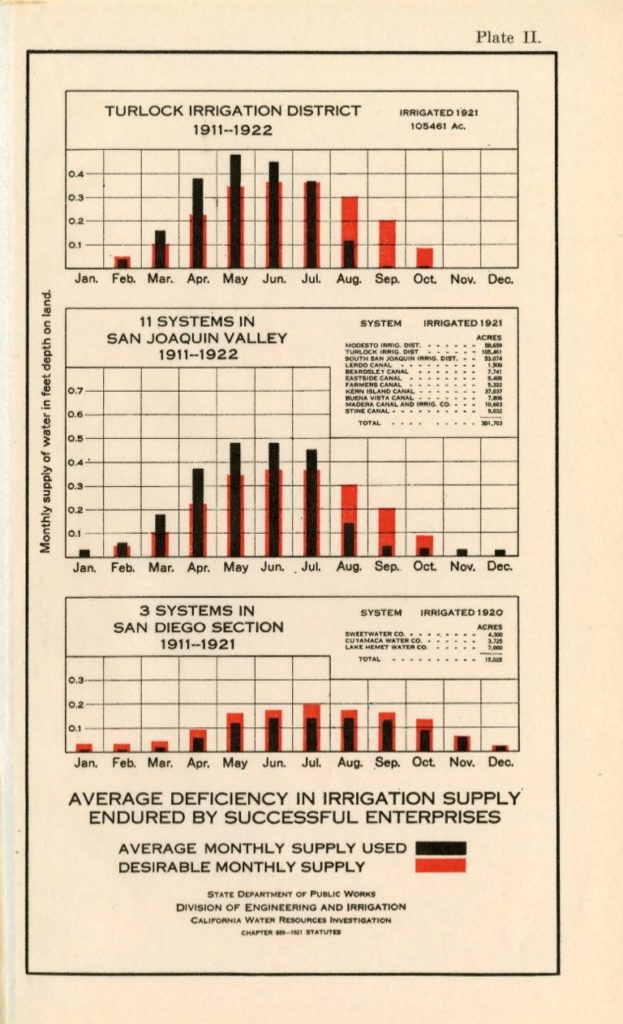
This data was collected between 1911-1921 and the only section with a positive deficiency (over the years, the desired monthly supply exceeded the average monthly supply used) was the San Diego area. Turlock and San Joaquin Valley exceeded the desired amount most of the months of the year, but kept their usage down between August and October. This chart is colorful and informative, but I have not been able to uncover if there are more charts exposing data between 1911 and 1922 for the other 13 Sections of California.
So, there you have it! Just a little bit of a deep dive into the data contained within the California Water Documents collection found in the Claremont Colleges Digital Library!