The Bending Water Project was recently featured during the 2021 Western Water Symposium presented by the Claremont Colleges Library. Jeanine Finn and Catalina Lopez assembled a fantastic presentation on the method of extracting datasets from the California Water Documents collection using optical character recognition software. The purpose of this blog is to summarize the datasets featured in the presentation and to provide helpful links to accessing the datasets within the collection.
Summary of Irrigated Crops, 1941
The first dataset presented on featured a Summary of Irrigated Crops in 1941. The reason why this dataset was selected was to highlight the ability of optical recognition software to identify a table within the text of a document and easily export the data into an easier to manage Excel Workbook file.
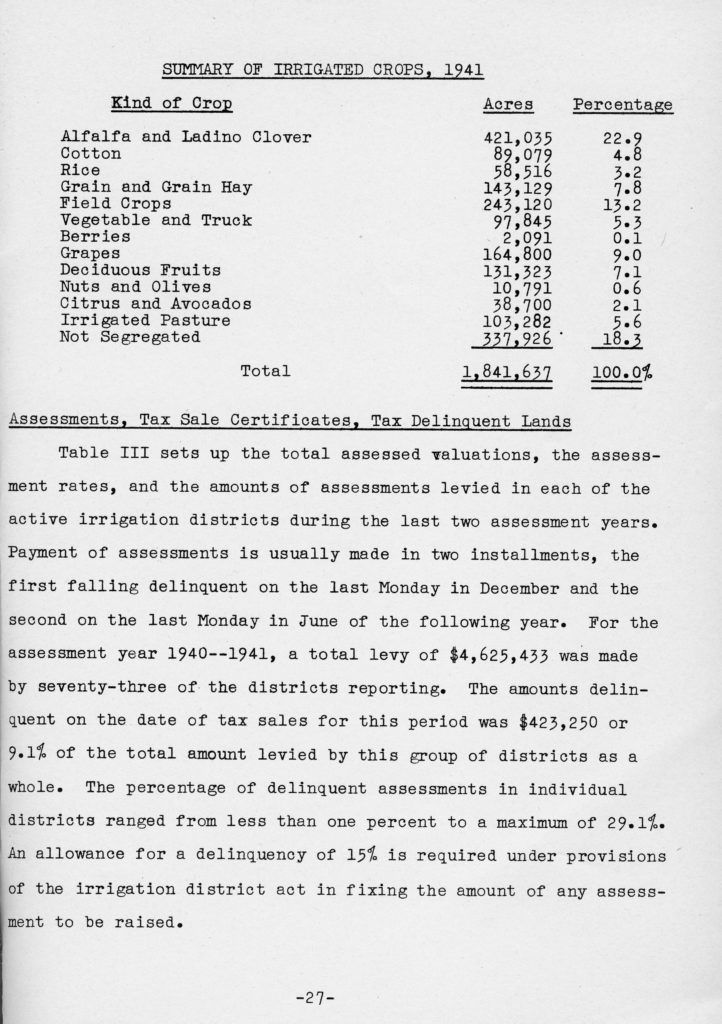
The genius of OCR software is it enables difficult to recognize data in a PDF document to be configured into an easy to manipulate document. Text recognition is ample in PDF documents, but numerical data is often left without context or unrecognizable by the software. A clean table like the crop summary provided here is easy to format into a CSV file that may be shared widely and contribute to research that requires the data.
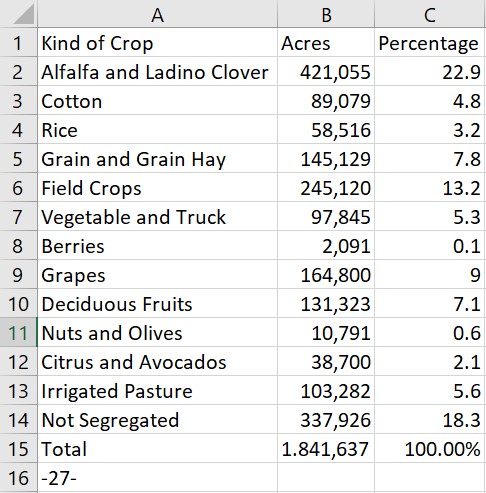
Here is the extracted Excel workbook featuring the data from Summary of Irrigated Crops, 1941. The data in Excel is much easier to work with than data in a PDF or Word document.
Discharge of Mokelumne River at Woodbridge, 1937
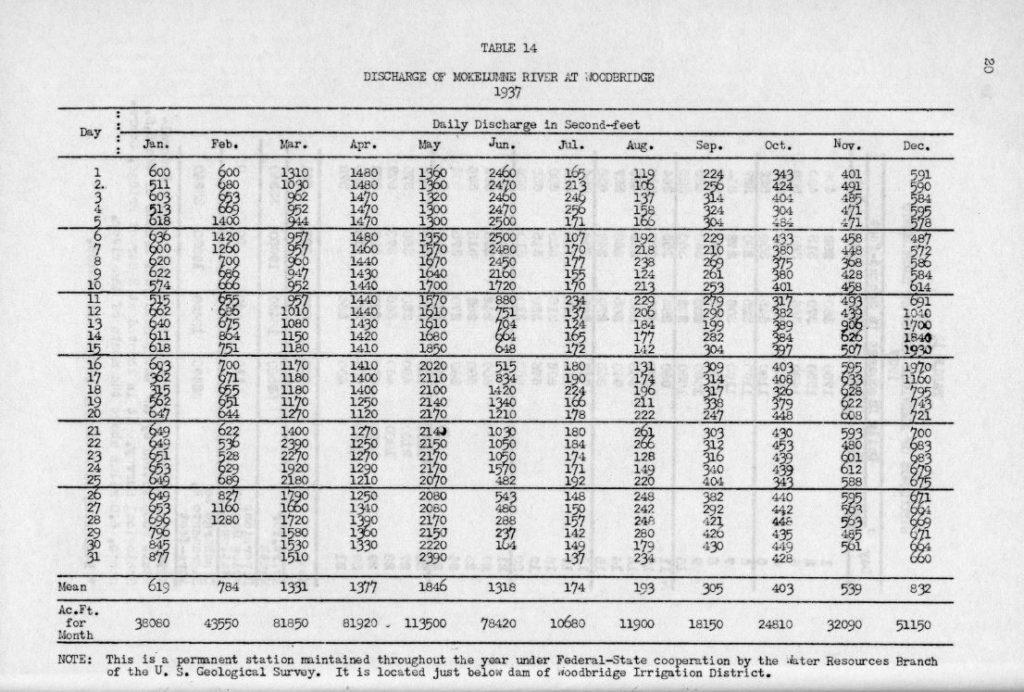
Pictured above is the screengrab from the original document, Report of Sacramento-San Joaquin Water Supervision for Year 1937. The Daily Discharge water tables carry a bulk of data as the record of flow is notated daily and for an entire calendar year. These tables from the collection tend to OCR pretty easily, but there is a large amount of data to verify.
The above image is grabbed from the Excel workbook created from the OCR software. The clean organization here is present in the extracted Excel workbook. Managing and running statistics on these tables is much easier in Excel as opposed to manually entering the data oneself.
Map of Wintering Bald Eagle Habitat
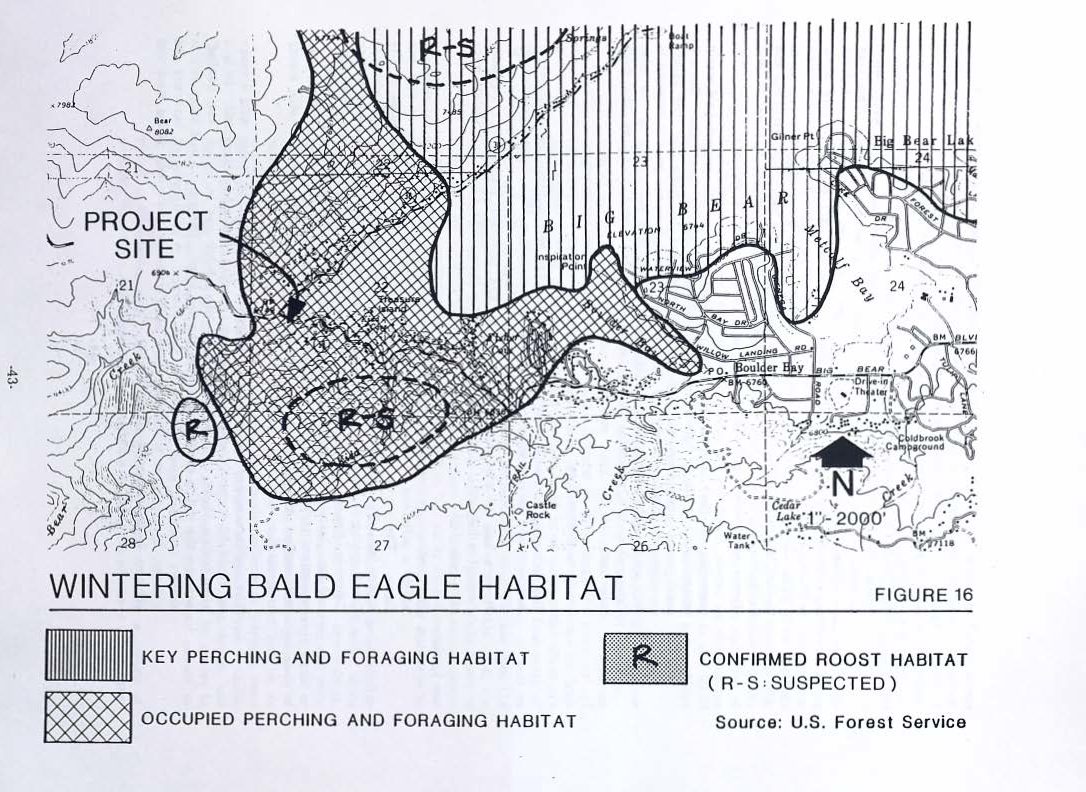
This example of a map was used to highlight the intricacies of gathering data from a map. Our project focuses on three main dataset types: tables, maps, and charts. Thus far, tables have been easy to OCR as the layout and text is recognizable by OCR software. The provided image from an environmental draft on the Bear Valley dam exhibits clear data, the map is nearly impossible to accurately OCR. We must use PDFs when handling intricate drawings and photographs.
CLASSIFICATION OF DAMS WITHIN STATE JURISDICTION
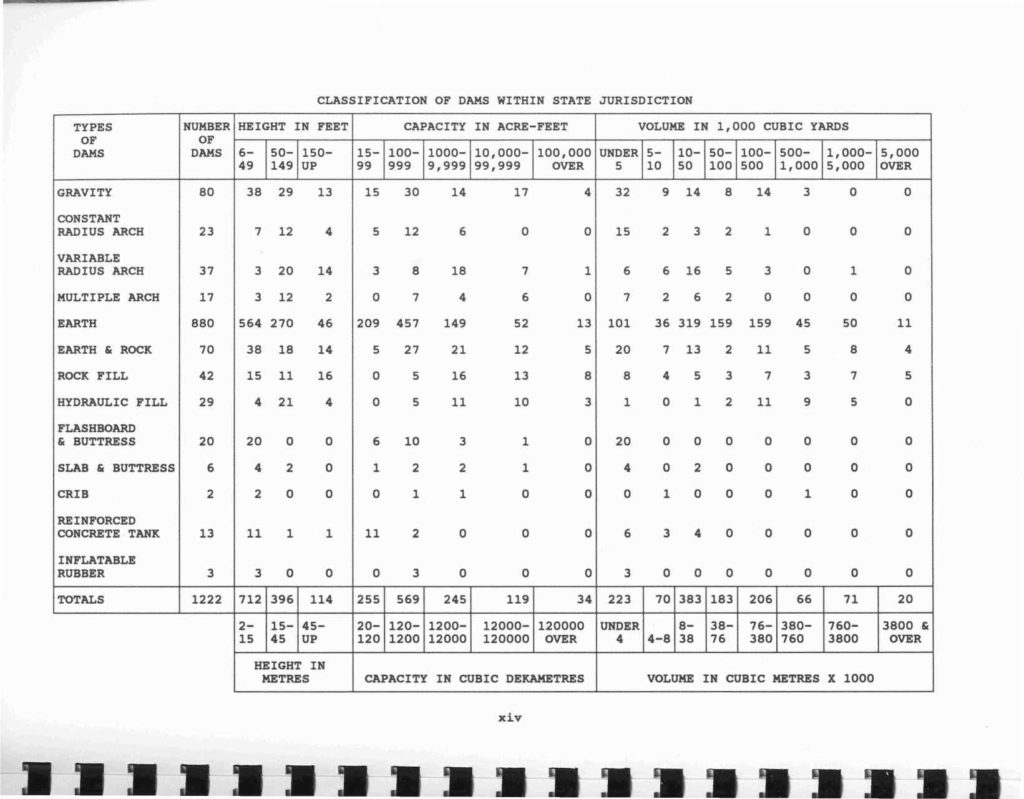
The table from “Dams within jurisdiction of the state of California, 1993 June” expressed another easy to OCR table.
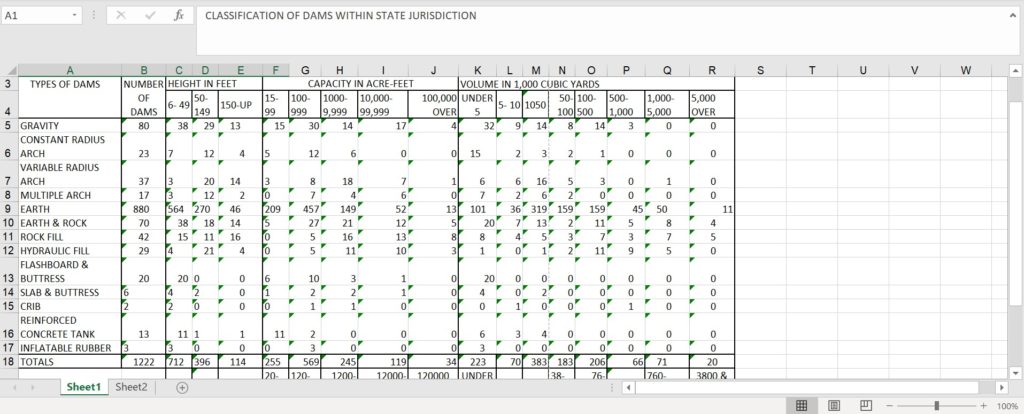
Here is the table after being exported to Excel. Easy to read, easy to work with, and easy to share. That is what makes OCR and data so compatible together.
Report of Sacramento-San Joaquin water supervision for year 1942, Chapter V, Plate 3 “Salinity Observations”
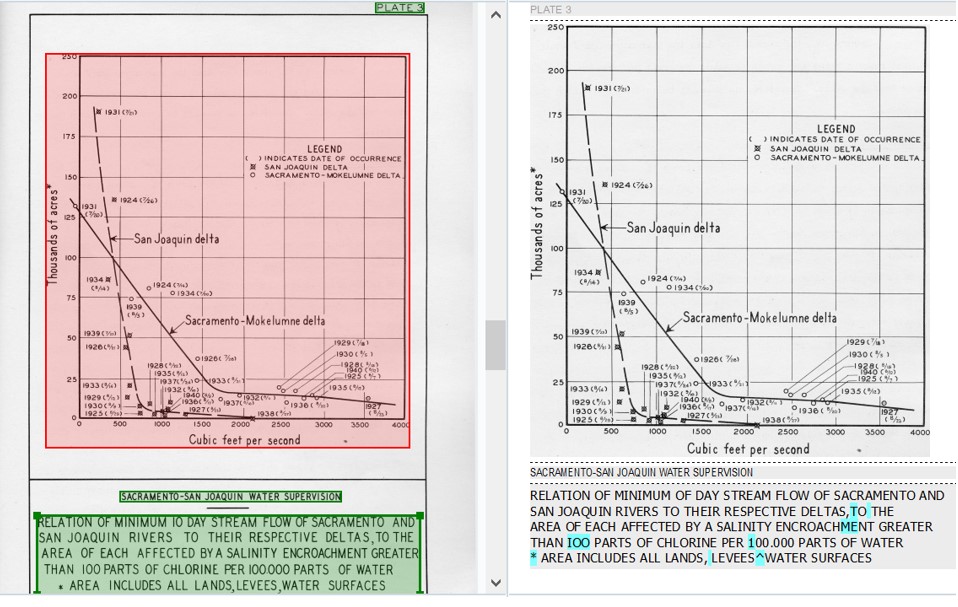
The maps above were provided during the presentation to highlight the limitations of the OCR software used. In the case of maps, the software recognizes the plain text, map descriptions and titles, but for images like a map, the software takes a screenshot and copies it into the extracted document.
Conclusion
The Western Water Symposium featured many new and exciting talks about the availability of recently digitized California water documents. These easy to access historical documents pave the way for new research into California’s water policies, politics, and practices. Collecting data and working through the numbers logically and easily will benefit current and future research endeavors of scholars for generations to come.