I would like to share a table in the California Water Documents Collection that was difficult to OCR. In previous blogs, I laid out the process of converting tables from PDFs into Excel spreadsheets. My goal is to highlight the tools necessary for speeding up the OCR process.
The OCR Editor
The table I wanted to OCR is from Report of Sacramento-San Joaquin water supervision for year 1938. While observing data in the California Water Documents Collection, I have noticed that tables become more difficult to decipher around Chapter 3. The table of focus comes from Chapter 3, Part 2 from the report for the year 1938.
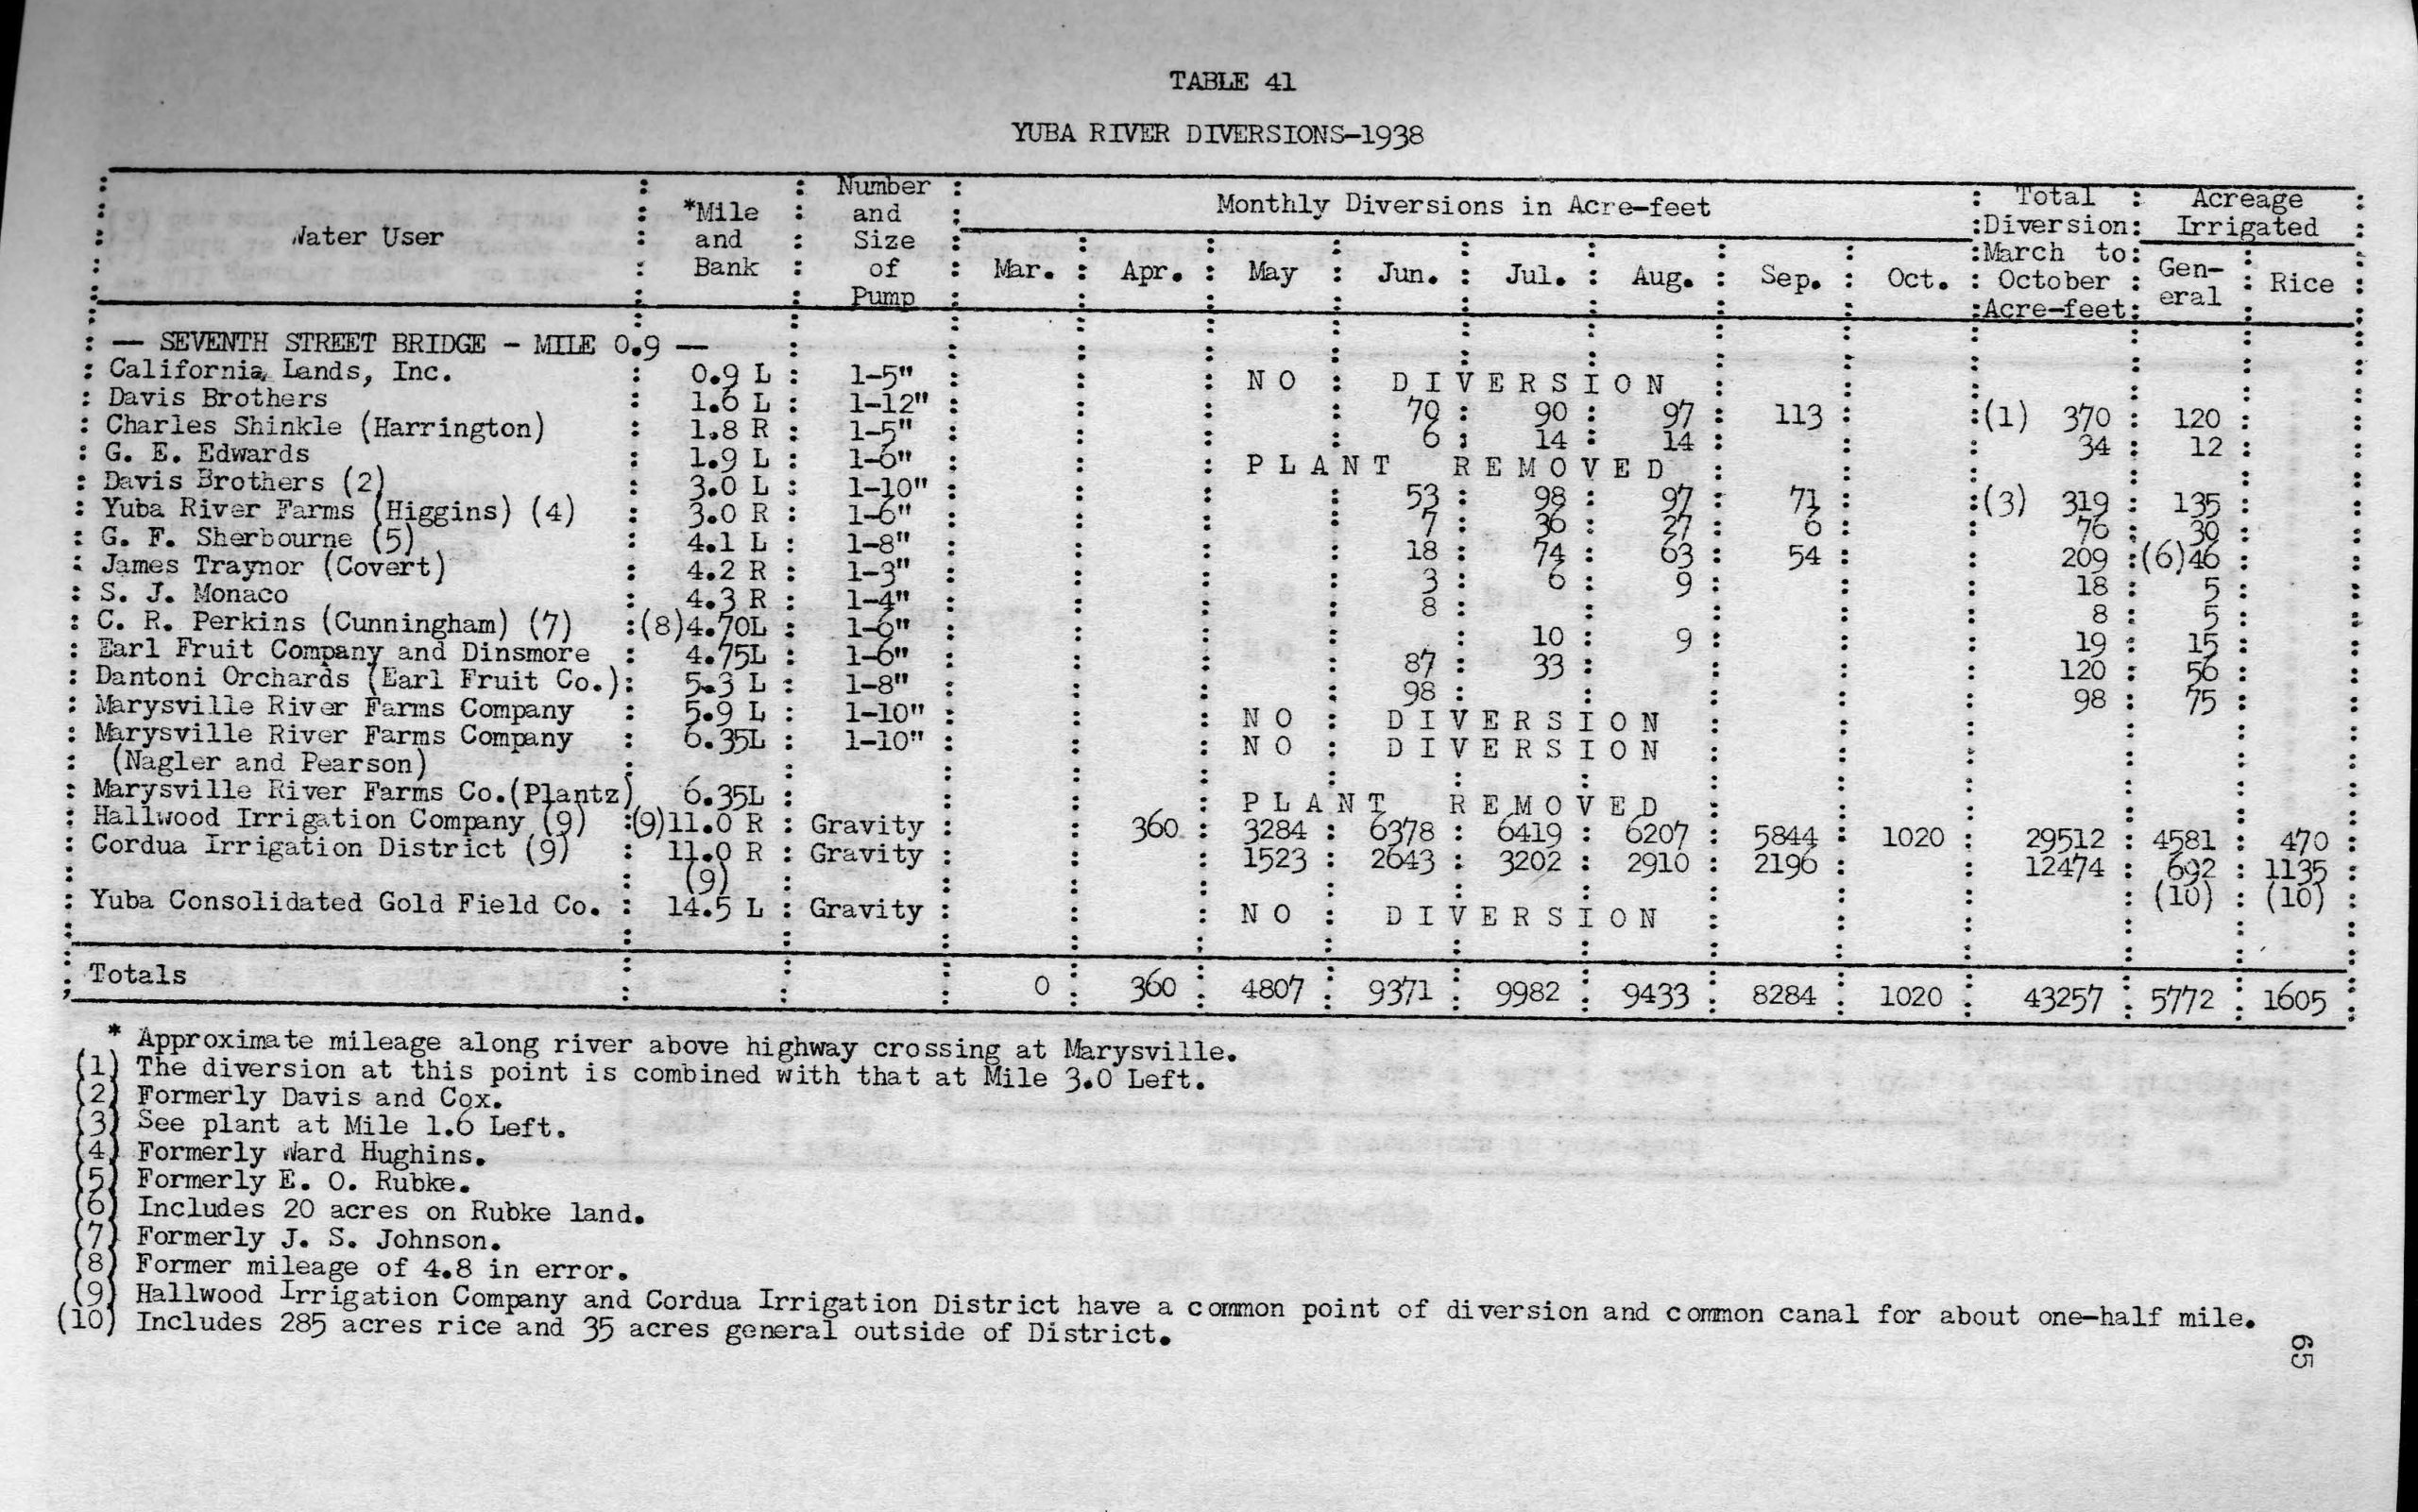
The “Yuba River Diversions-1938” table seems easy enough to OCR, but here is what happens when you open the file with an OCR Editor.
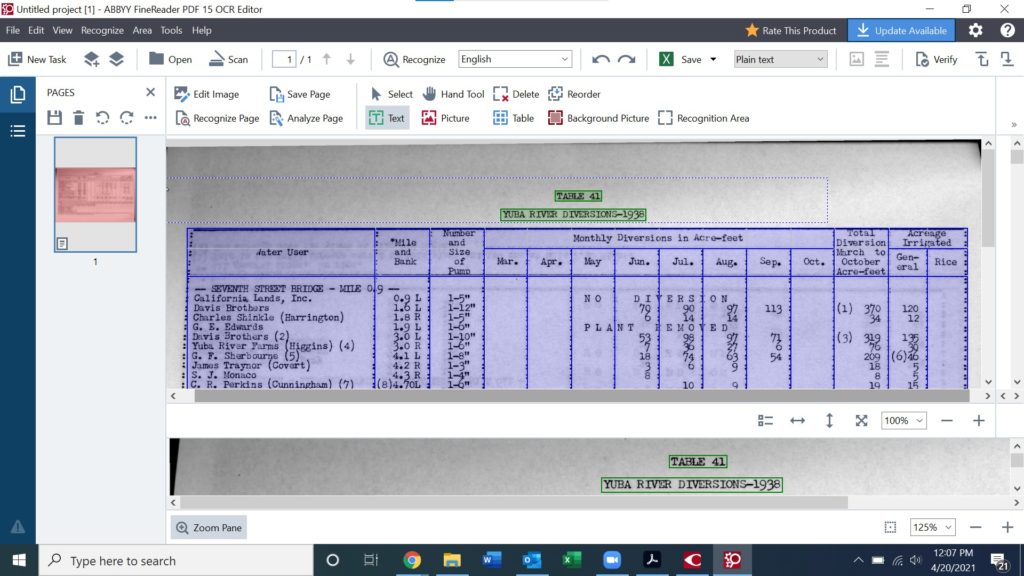
The purple field with blue lines indicates an area recognized as a table. The green plain text field is accurate, but the table field has a column slicing through data (Seventh Street Ridge – Mile 0.9 – right below “Water User” in the top left of the table). I also have to create my own rows in order to preserve synchronization of the data.
OCR Tools
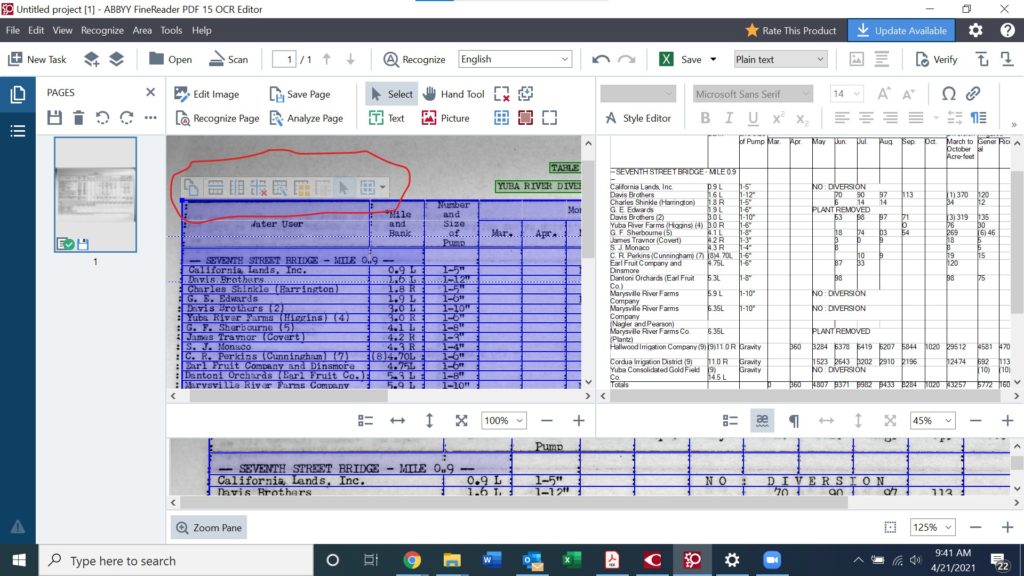
A tool bar appears when hovering the mouse over the table field in the OCR Editor. The blue column, left to right, box allows rows to be spliced into the table. Fortunately, all of the rows in this table are accurate. In order to clear the data hindered by the first row in the table, shift-select the two boxes cutting off “0.9” and select the tool “Merge Table Cells.” This conjoins the two cells and preserves the data organization.
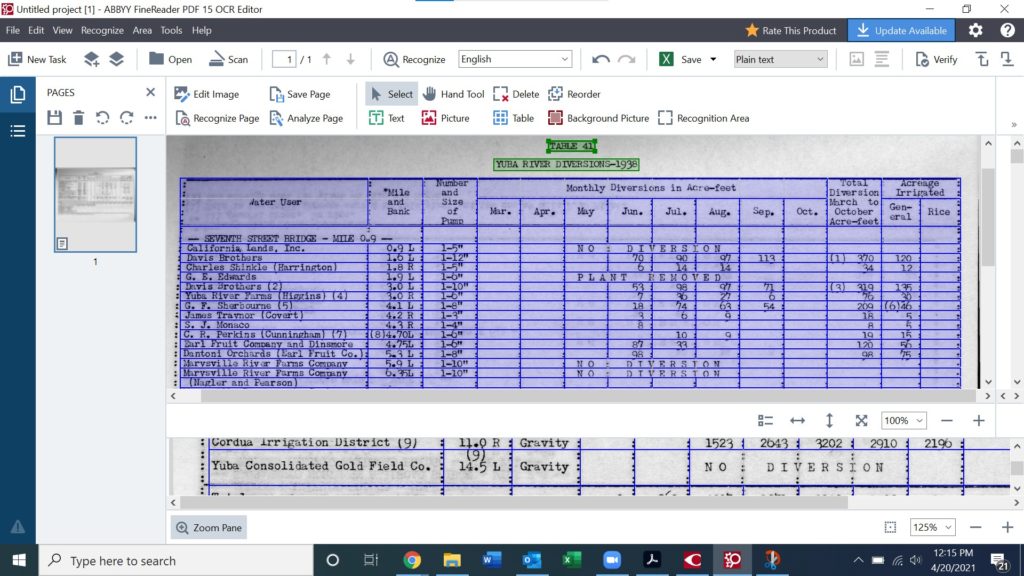
Above is the finished product. For the “NO : DIVERSION” and “PLANT REMOVED” data, merging the table cells is up to the discretion of the editor. I had to adjust the plain text box below the table in order to preserve the 1-9 bullets of additional information.
Verification
Once an appropriate table is constructed and the page has been re-recognized, the next step is to verify low-confidence characters. Most of the low-confidence characters are accurate and may be skipped.
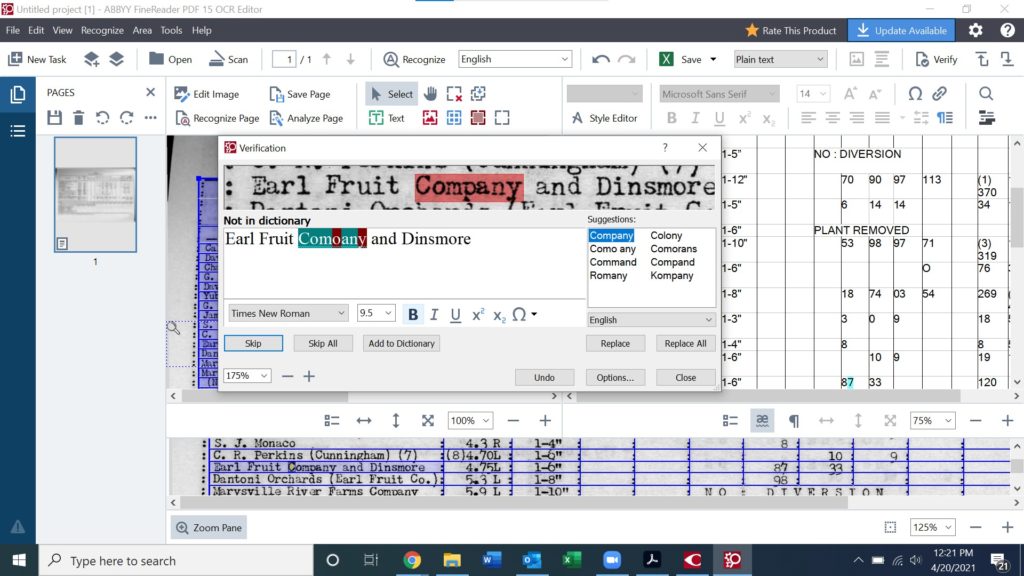
Spelling errors are a common occurrence once a page is recognized. It is easier to edit in the verification window rather than use the Suggestion window. Most files in the California Water Documents Collection have 50 to 100 characters that need to be verified, but multi-page documents have beyond 200.
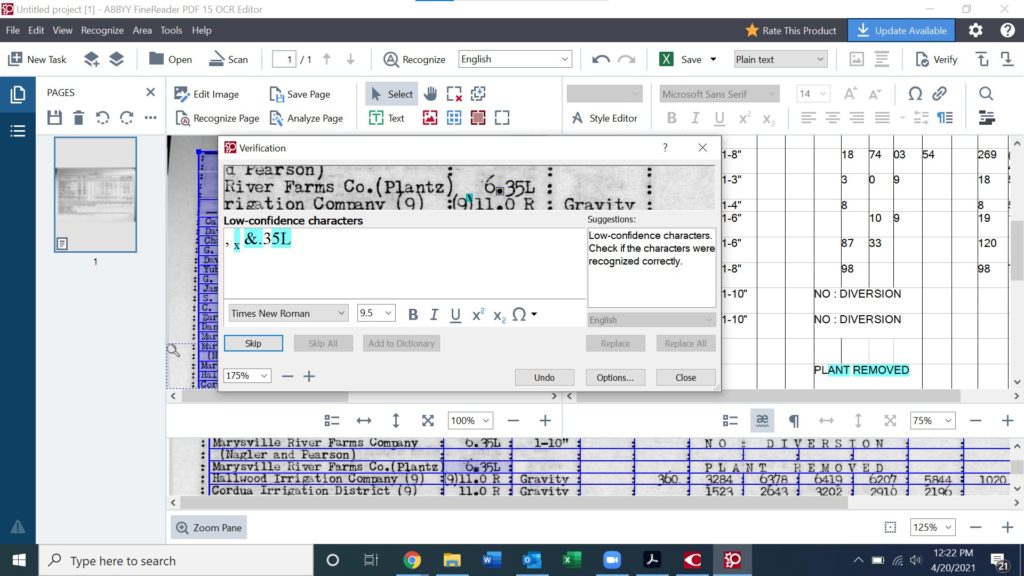
Some verification requires adjustment from data in a separate cell. In the case of the above image from Table 41, the parentheses from the cell below “6.35L” is impeding on the recognition process. Using the eyes and cross-referencing between multiple images of the product make it easy to conform to accurate cell data. The process is rather tedious but rewarding.
Exporting to Excel
The final step in the process is to export the table as a Microsoft Excel document.
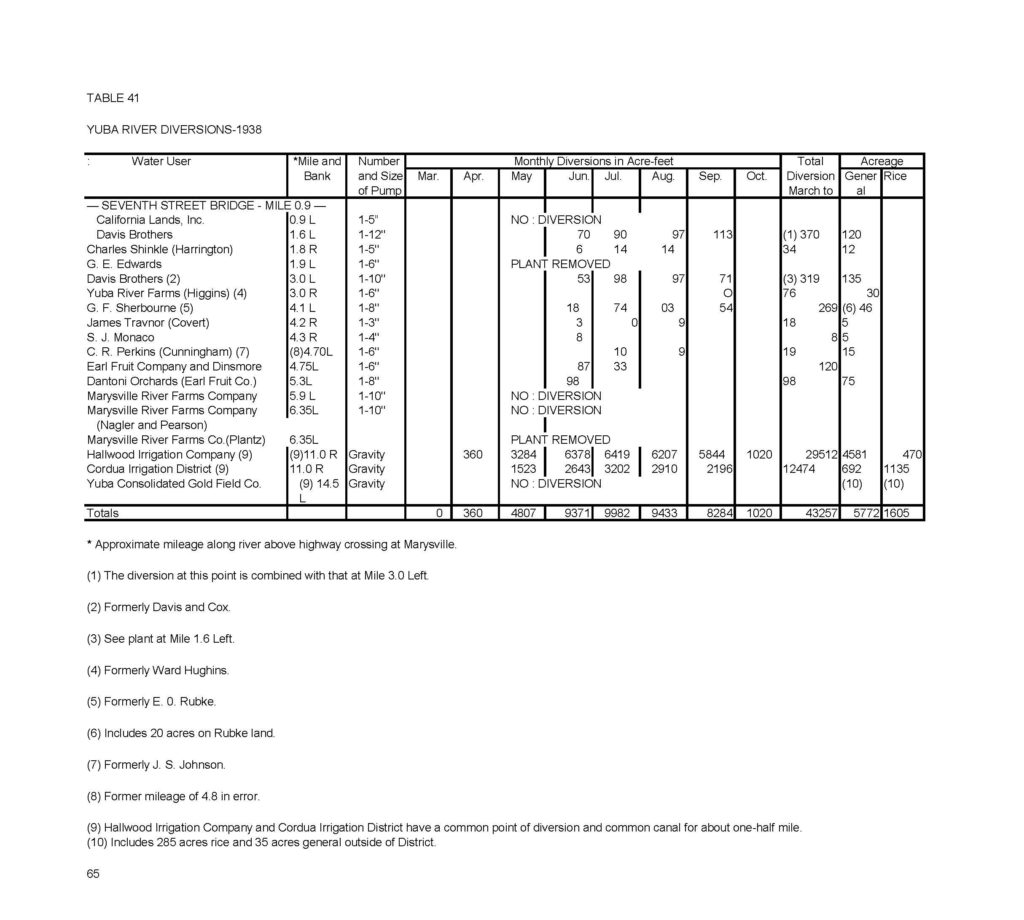
In the above image, it is clear what monthly water diversion numbers agree with the water user. The spelling is checked, the plain text is accurate, and the cells match the original document to nearly the exact measurement. The final product is more spaced out than the original, but this does allow for easier editing.
Conclusion
I hope this was a fairly easy to comprehend description of what to do when a file has a haphazard OCR process. The work is tedious, but the final product is worth the effort. Imagining what preserving this data does for future researchers is enough motivation to double-check hundreds of rows and columns.