Today’s example of data is an oversized map from Report on the water resources of the Temecula and Santa Margarita Rivers, 1922. The report was prepared by Willis S. Jones and examines a proposed dam site at the Pauba Reservoir. This map is unique for three reasons: the details of the map’s legend, the selective borders drawn on the map, and the central location of the document’s subject.
The Creator
Willis S. Jones comes up often in the Bending Water Collection. Willis S. Jones was a consulting engineer for the Consolidated Water Company of Pomona in 1907 and superintendent of Claremont Domestic Water Company. He built dams along the Santa Margarita and Temecula River on the Pauba Ranch near Temecula, California. The following map shows the land area surveyed by his report.
The Map
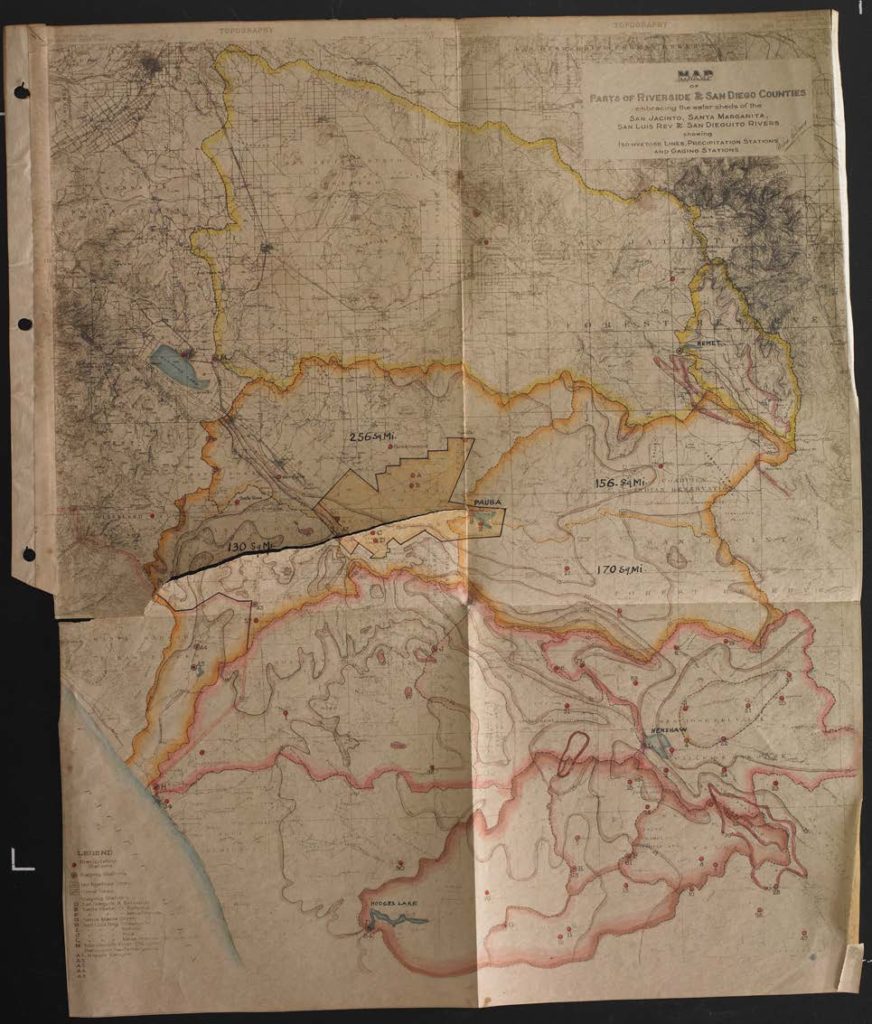
This map is a general map provided early on in the report. This helps readers visualize the surrounding area that the water resources serve. What I enjoy most about this map are the colored boundaries of areas serviced by the Temecula and Santa Margarita rivers. Square miles notes in the territories help the user imagine the size of the area. Pauba Ranch is directly in the center and focal point of the map. The legend indicates gaging stations by red dots and precipitation stations by black dots.
Conclusion
This map is a colorful addition to the collection. There are more specific maps that cover smaller land area, but I enjoy seeing these two large counties in California represented in a map from the early twentieth century. The map is difficult to read, but the data here provides researchers with a general overview of the rivers observed by the report.